
Executive Summary:
We are in an unprecedented pandemic that has caused hundreds of millions of people to seek solace, shelter and comfort in their homes. This has resulted in a massive shift in consumer spending that turned last year, 2020, into the ‘Year of the Home’.
But if 2020 was the year of the home, what was 2021? Did this wave of spending by households continue, grow or subside? And what can we expect going into 2022 and beyond given what we know about the mindset of the consumer when it comes to investing and spending, both time and money, in their homes?
This year’s State of Home Spending report answers all these questions and supplies new insights into consumer behavior entering 2022.
The growth in improvement spending continued at a dizzying pace, mirroring both the unprecedented time Americans have spent in their homes and the unprecedented discovery of trillions of dollars in unexpected home equity unlocked by the nation’s homeowners. The growth in home improvement spending also reflects the renewed focus on the home as the center of our lives as more people work from home, dine at home and choose to spend time at home.
Lifestyle concerns continue to beat out financial reasons as the primary factor driving demand for home improvement projects. This makes sense in a time when household wealth is up for so many of the nation’s homeowners and when a global pandemic has reaffirmed the importance of the home and a healthy, happy life.
When thinking about what changed between 2020 and 2021, we saw, as people settled into the new normal, a consistent rise in spending on home improvement. However, this increase was not without certain challenges.
For the second year in a row, disruptions due to the pandemic were the primary reason for not undertaking projects, suggesting pent-up demand that we expect to see turn into action as supply chains recover and public health fears subside.
Despite these disruptions, skilled trades pros appear to have done a better job this year at communicating expected timelines and planning for disruptions, as both budget and schedule overruns declined relative since 2020. This year, pros adopted more technologies and we saw 42% of pros using new digital tools for project planning. Still, projects are more likely to go over budget than to be under budget and more likely to go over time than finish ahead of schedule.
2021 will likely be remembered as one of the most interesting years for studying and understanding shifting consumer behavior and homeowner priorities around the home. This year’s State of Home Spending report is a deep dive into understanding this dynamic and the critical trends surrounding it.
Mischa Fisher
Chief Economist, Angi
KEY TAKEAWAYS
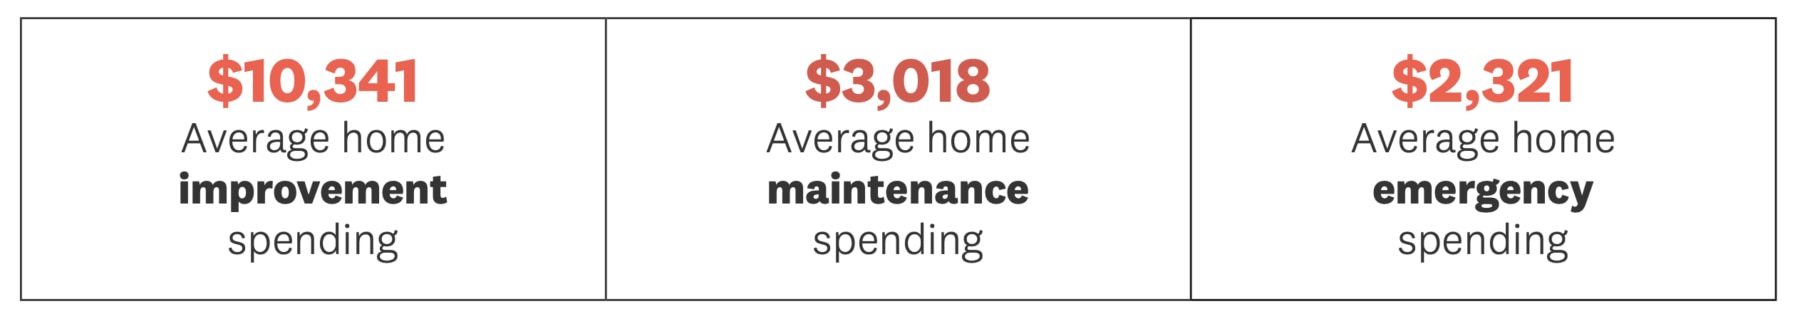
- Home improvement spending rose 25% year-over-year to $10,341. Homeowners who invested in home improvement did an average of 3.7 projects, up from 2.7 in 2020, averaging approximately $2,800 per project.
- Home maintenance spending largely held steady, with a slight 4% decrease to $3,018. The average number of completed maintenance projects was 8.5, up from 7.48 projects in 2020. Homeowners completed an average of 3.4 landscaping jobs, 2.5 cleaning jobs, and 2.9 other maintenance projects.
- Home emergency spending rose 42% year-over-year to $2,321 across 2.2 projects per household. This is not a surprising increase as climate change drives more extreme weather and people continue to spend more time at home.
- The top three most popular projects of 2021 were interior painting (32%), bathroom remodels (28%) and smart home device installations (27%). While bathroom remodels and interior painting were in the top three projects last year, this is the first year we have seen smart home device installations as a top three project.
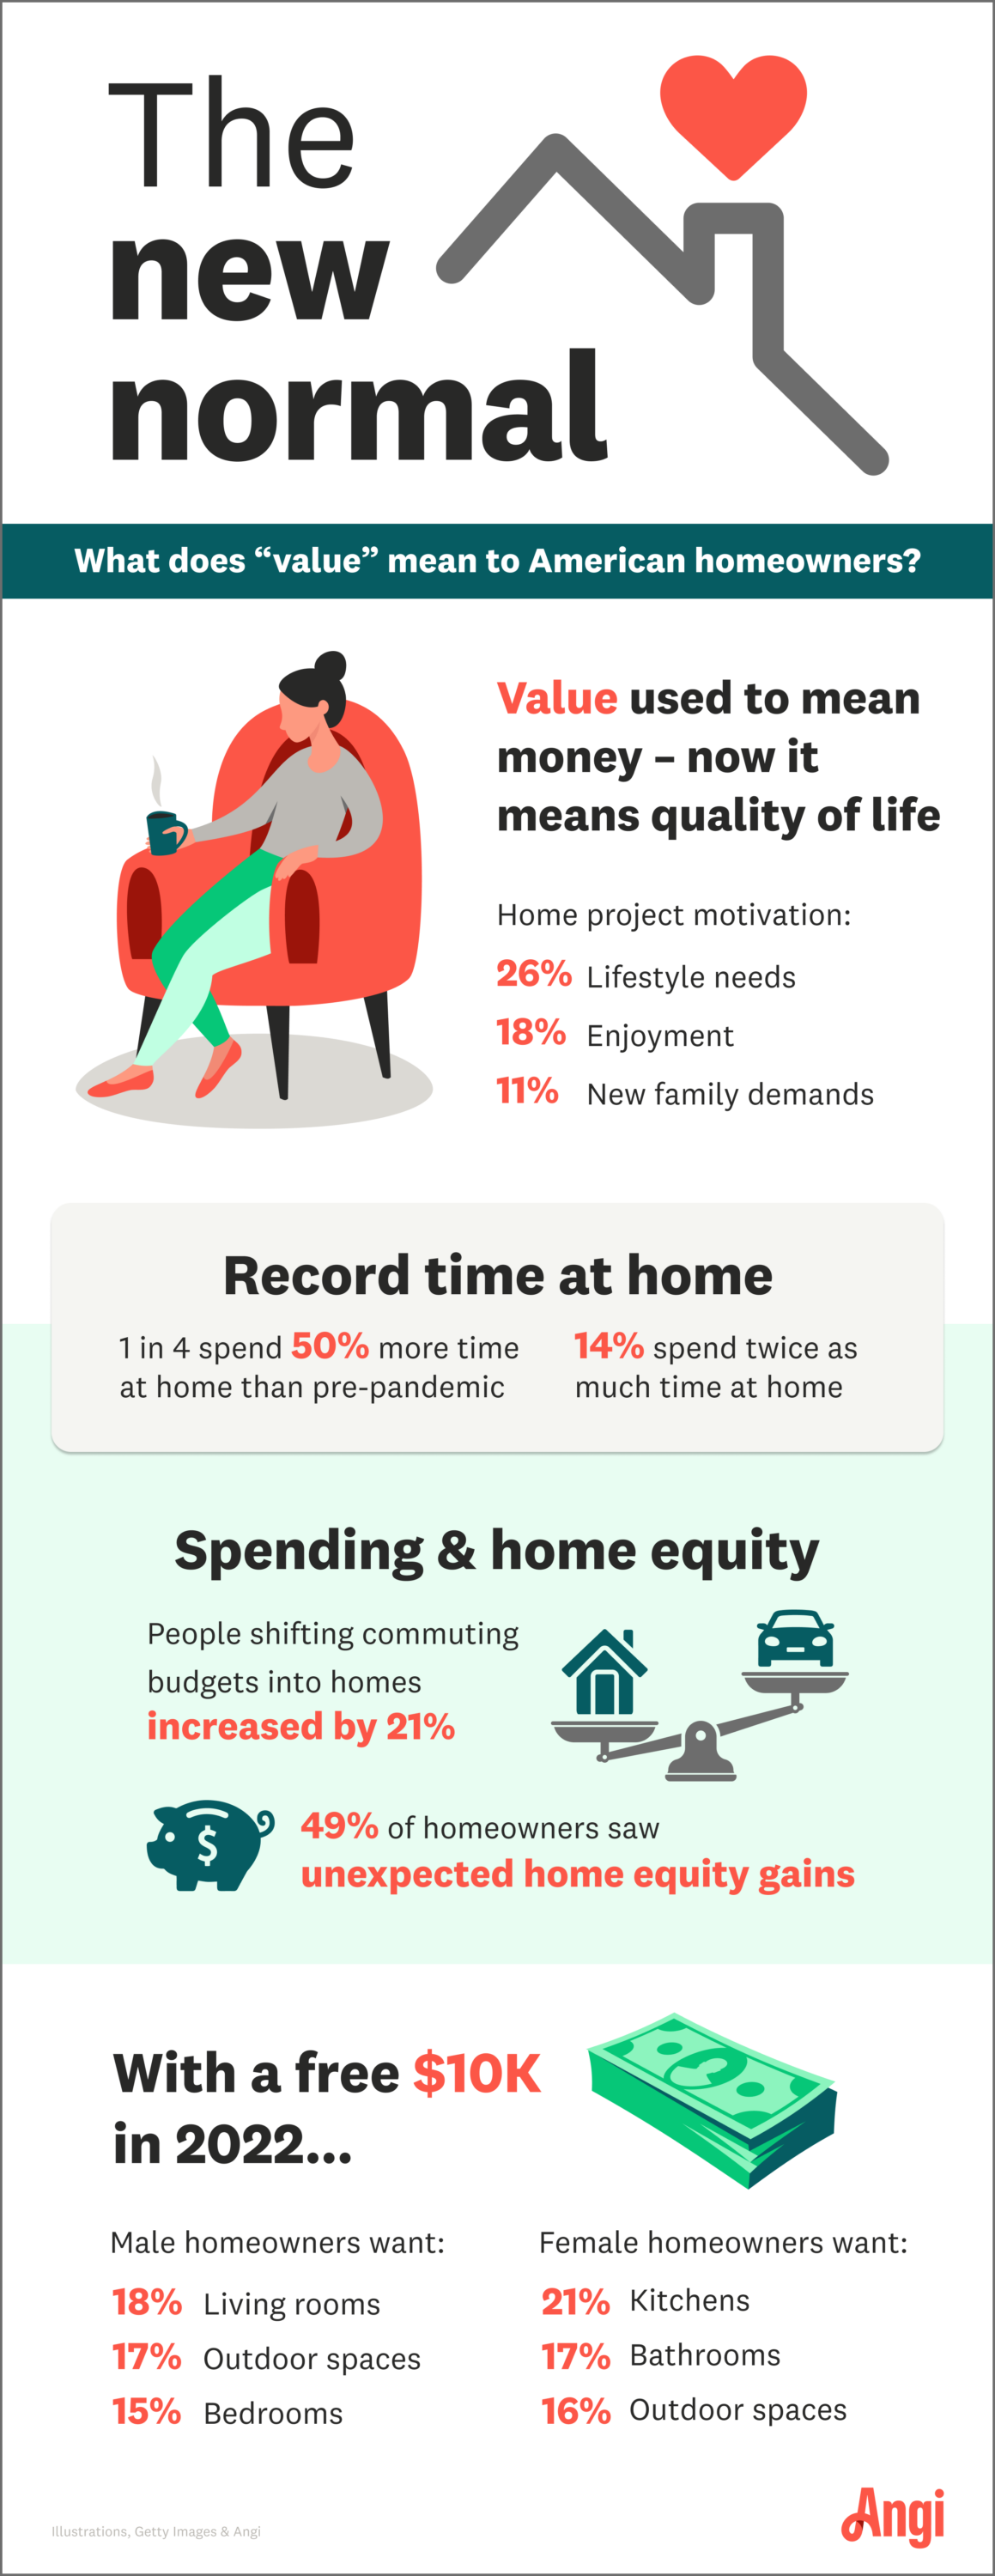
- The top reason for completing a home improvement project was to make the home better suit lifestyle needs, which was the primary reason among over a quarter (26%) of all households. Prior to the start of the pandemic, return on investment or other financial reasons were consistently the top motivator for improvement spending.
- The top two reasons projects were not completed are COVID-19 disruptions (26%) and materials being too expensive (22%).
- Supply chain disruptions are taking their toll, as delayed projects are about twice as likely to be a result of materials taking longer than expected to arrive (22% of projects) than from unexpected permitting issues (11%).
- 25% of the population is now spending 50% or more time at home than they were in 2019, the last full year before the global pandemic changed how so many people live and work. Moreover, 14% of the population has doubled the amount of time they spend at home.
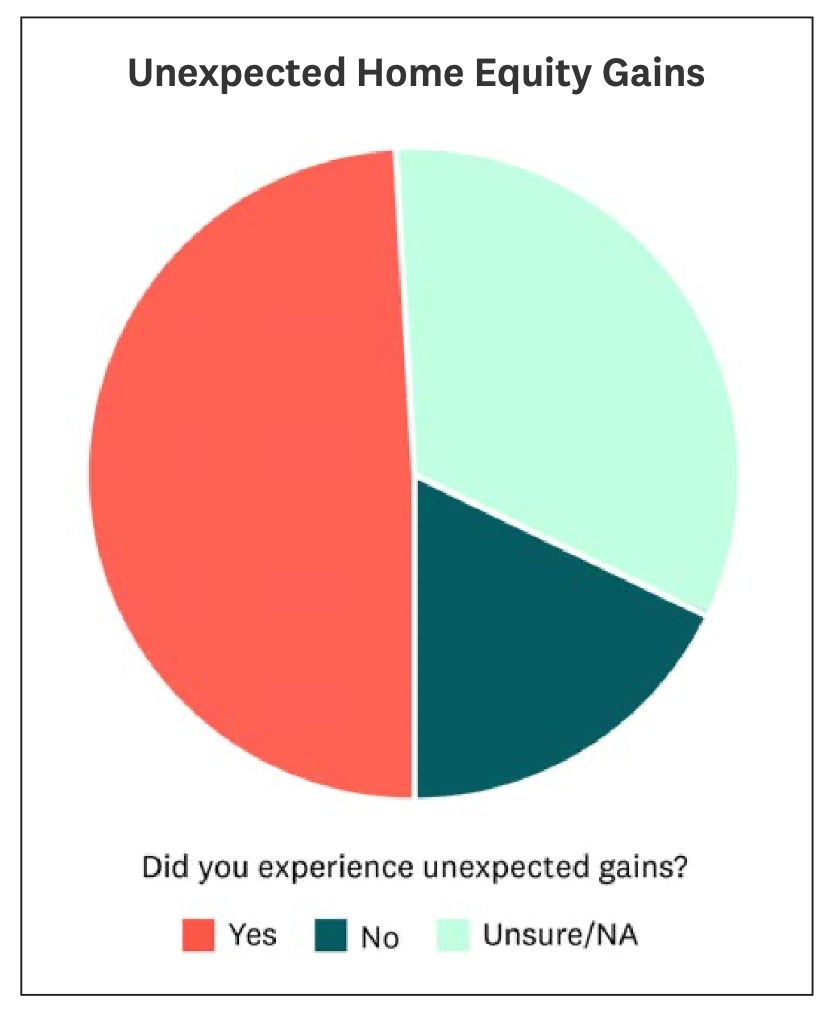
- Half of all homeowners (49%) experienced unexpected home equity gains, opening the door to trillions of new dollars available for home improvement, maintenance and emergency
PART 1: THE STATE OF HOME SPENDING IN 2021
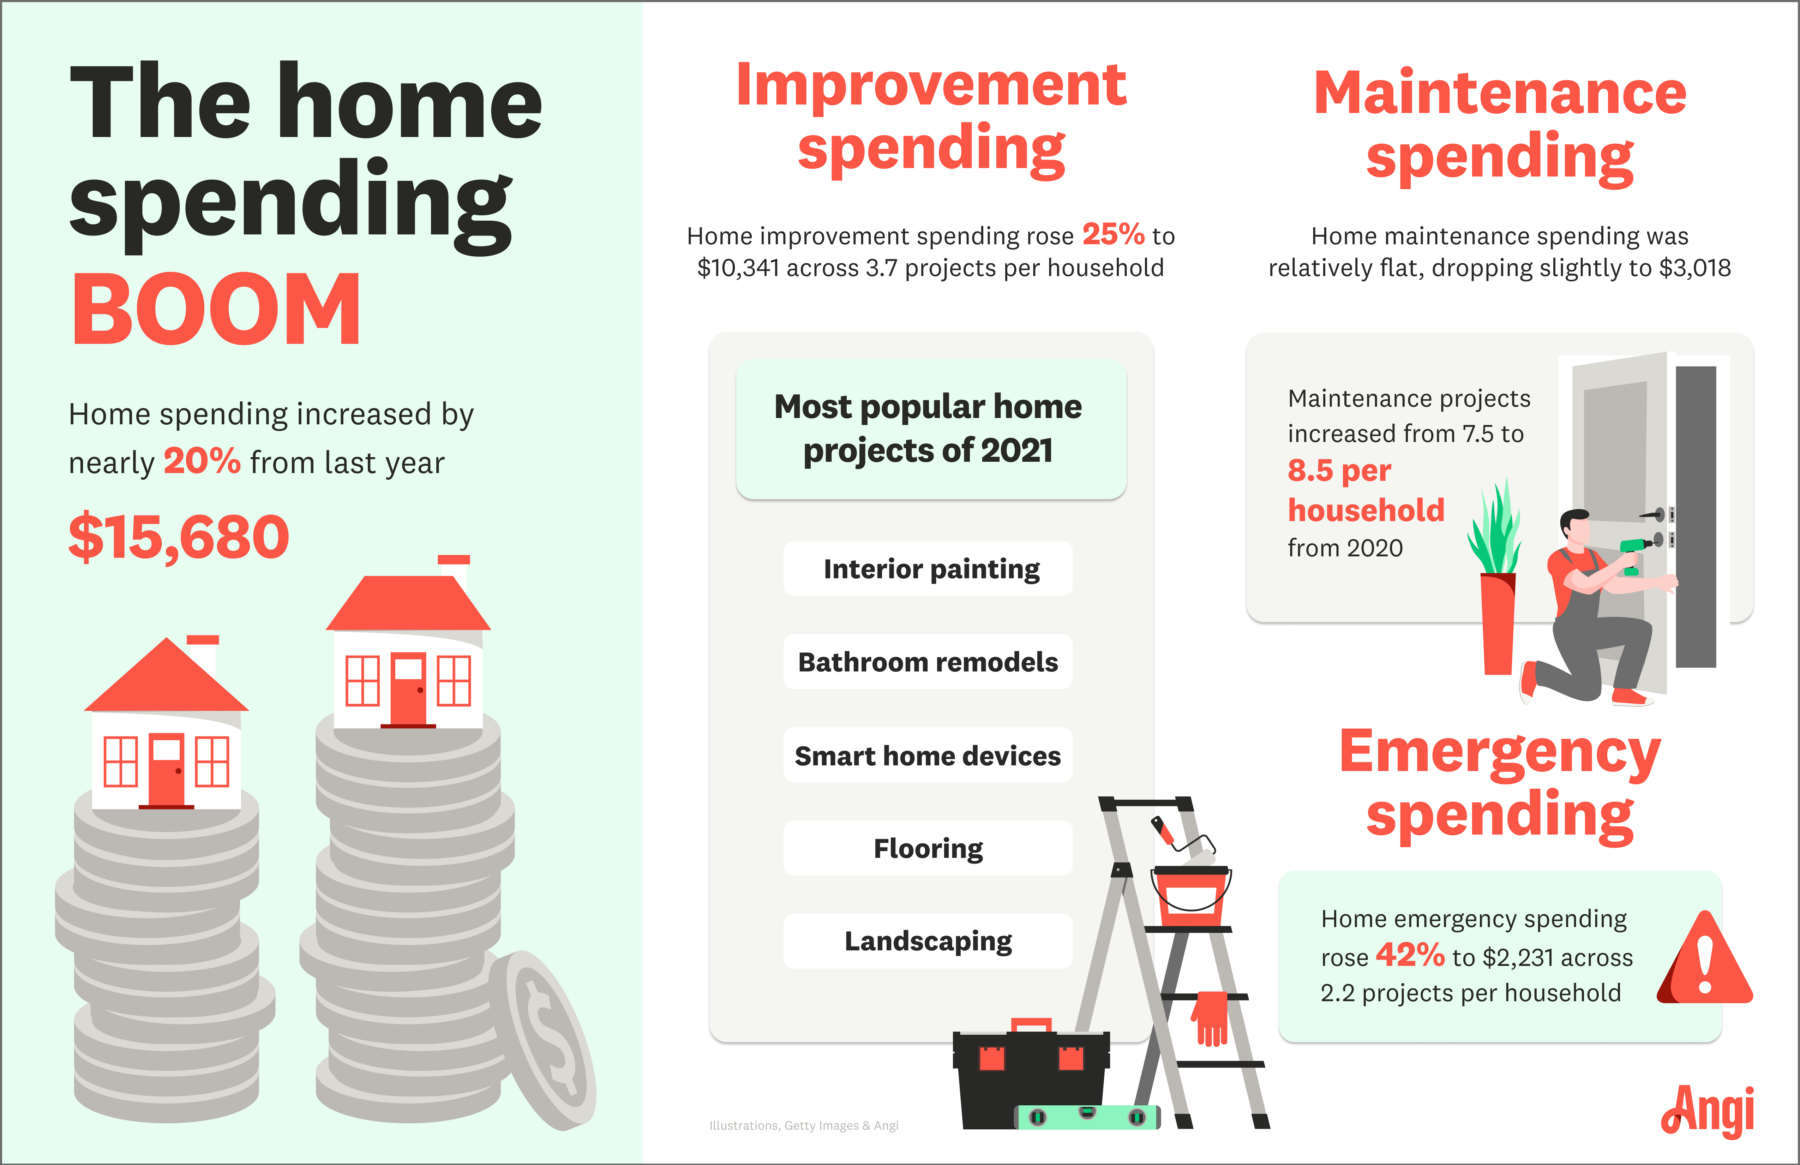
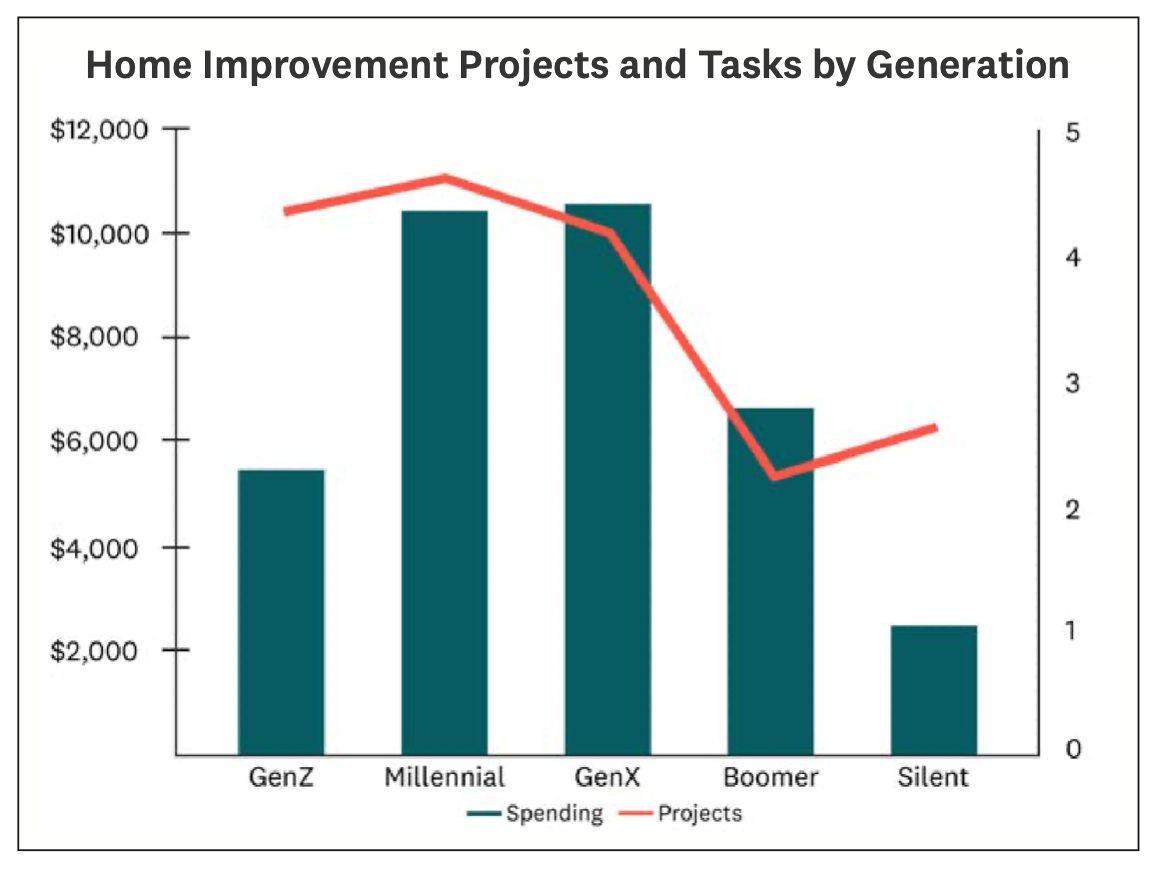
In 2021, homeowners doubled down on improvement spending and largely held steady in maintenance spending, with a modest pullback. Emergency spending saw the largest year-over-year increase of the three categories as we continued to spend more time at home, increasing wear and tear, and due to damage caused by extreme weather in certain areas of the country, such as flooding in New York, wildfires in California and the ice storm in Texas. Across all three categories of home spending, improvement, maintenance and emergencies, total average spending increased to $15,680 across an average of 14.4 projects.
What we see in our measurement of homeowner spending aligns with the story around the prolonged impacts of the COVID–19 pandemic. The home is more important than any time in recent history and, as work is being redefined in the U.S. by the Great Resignation, people across the country are moving into new homes in record numbers. And as people move, especially millennials, they are moving to bigger homes that are a little older and a little further away from the city center. Our research shows the clear impact that trend has had on home project spending, especially improvement spending.
Our measurement of homeowner spending is focused not only on capturing a broader range of spending behaviors than others may track, but also on categorizing spending according to a more intuitive model of how consumers view their spending: planned spending on making their homes better (improvement/remodeling), planned spending on preserving their homes’ value and preventing deterioration (maintenance and upkeep), and unplanned spending on repairing their homes to their prior condition (emergency repairs).
1.1 Home Improvement and Remodeling Spending
Home improvement spending increased considerably over the last year, growing 25% to an average of $10,341, while the number of projects completed outpaced even this growth, rising 34% to 3.7 projects per household on average. In the seven years we have been tracking homeowner spending on home improvement and remodeling, this is the highest average spending.
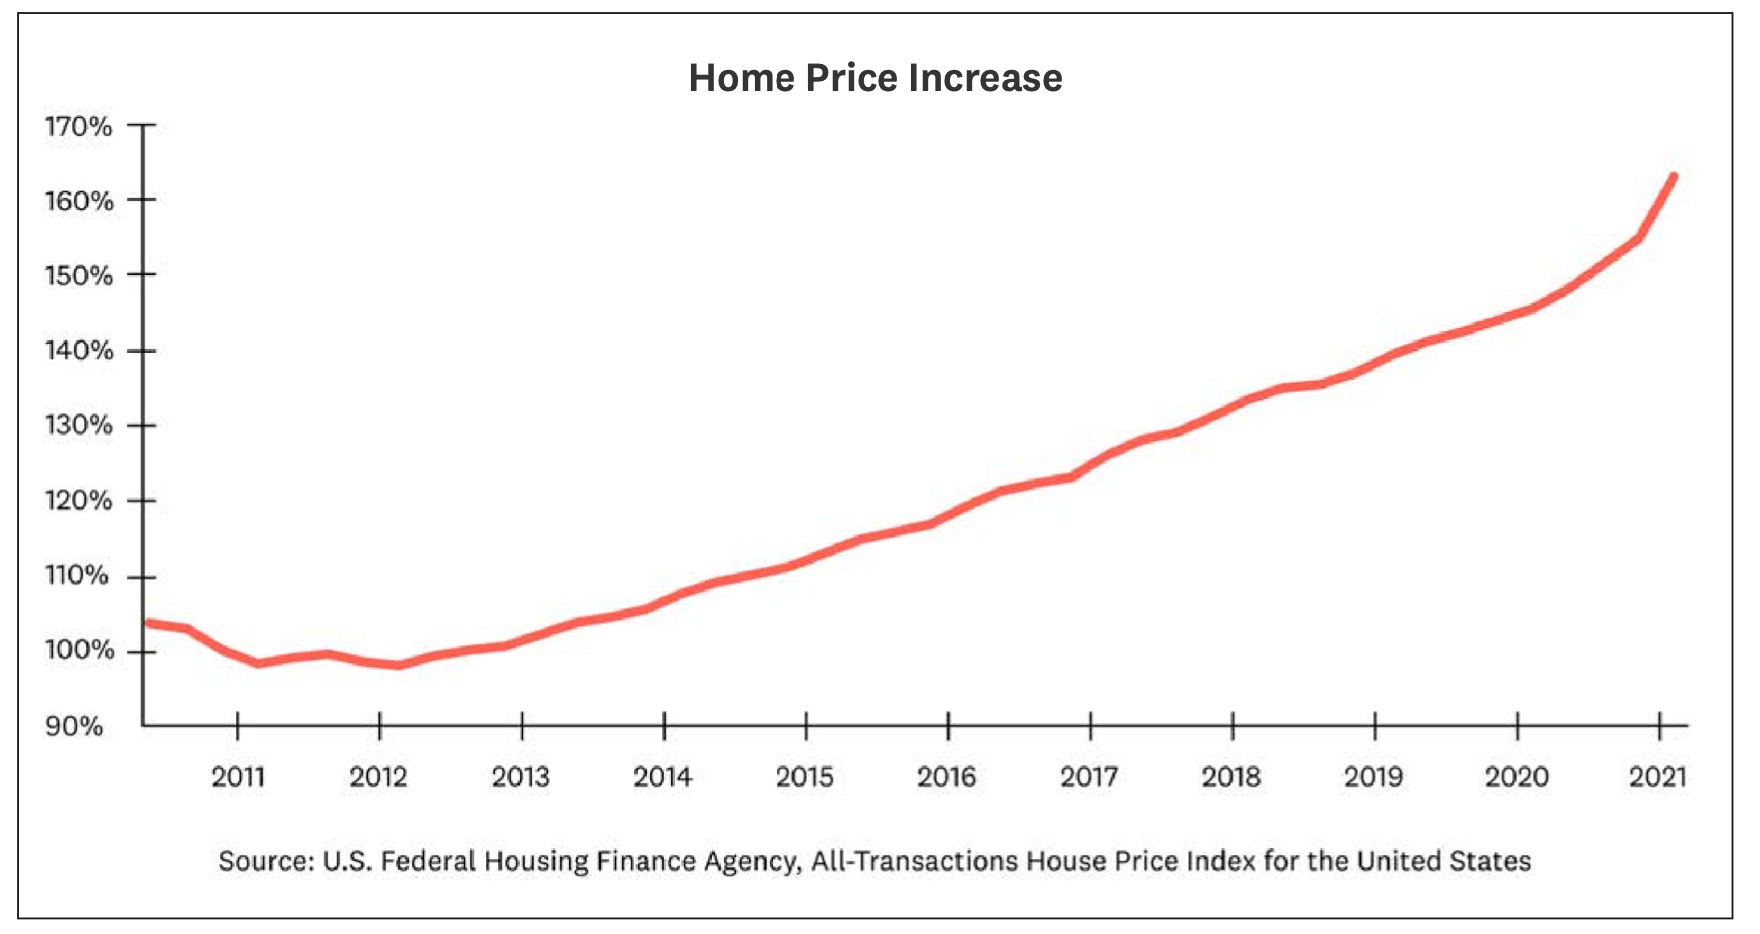
With an increased focus on the home due to the pandemic, home prices rising to the highest on record (nearly 20% year-over-year), and materials prices in some cases 400% higher or more than their pre-pandemic levels, the major growth in total consumer spending on home improvement should not come as a surprise.
The top reason for completing a home improvement project was to make the home better suit lifestyle needs, which was the primary reason among over a quarter (26%) of all households. Prior to the start of the pandemic, return on investment or other financial reasons were consistently the top motivator for improvement spending.
In addition to the desire to improve spaces for livability, an additional underlying cause for the extra spending was an increase in the number projects completed. While we have seen home improvement prices increase, we also found that the number of home improvement projects homeowners completed rose to a total of 3.7 projects – an average increase of one project per household from 2020. While this might sound small, one additional home improvement project per year is a big shift in homeowner behavior.
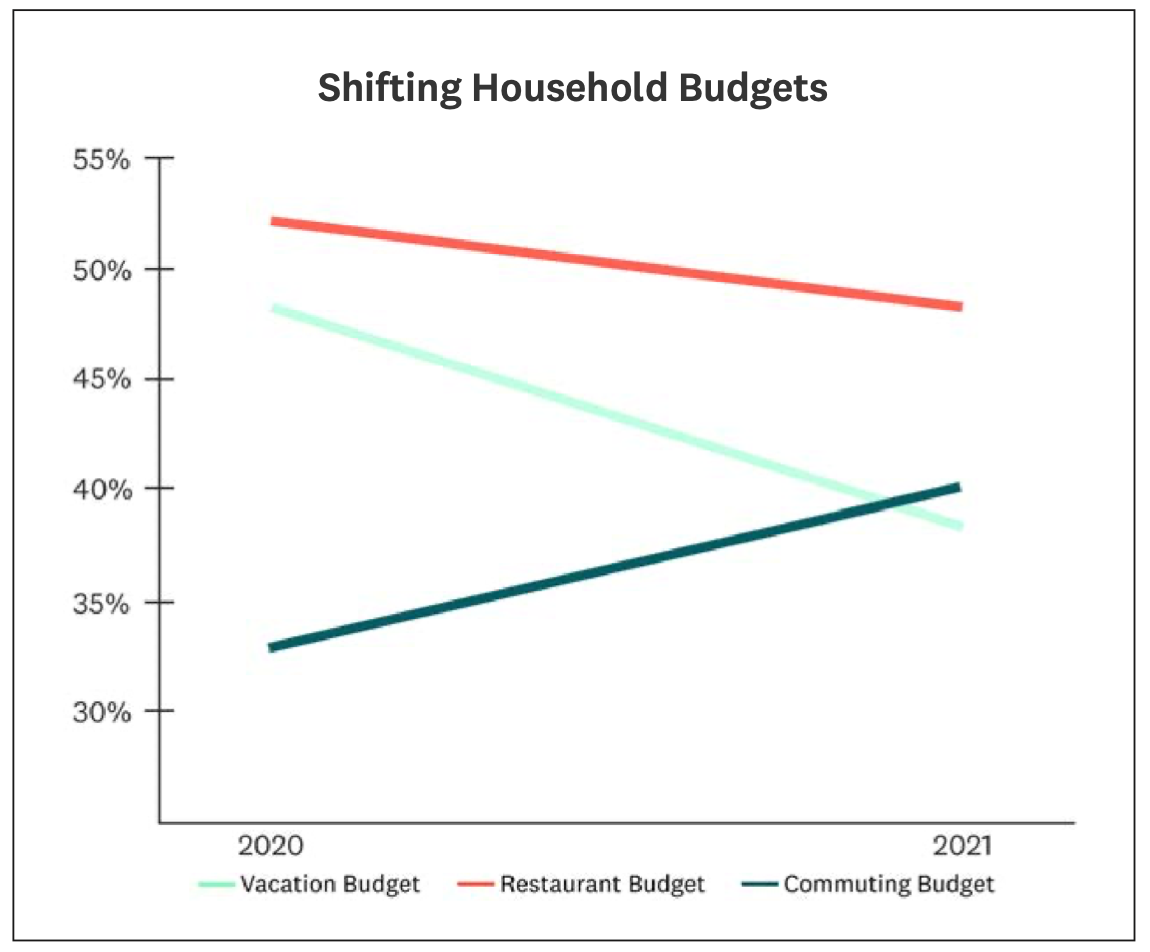
We also saw that spending was fueled in part by budget shifting among homeowners, who, like last year, transferred some of their money originally allotted for commuting, restaurants and vacations into spending on their homes.
As working from home and flexible work locations continued to be an option for millions of workers, 92% of households shifted some percent of either their dining, travel or commuting budgets into spending on their homes.
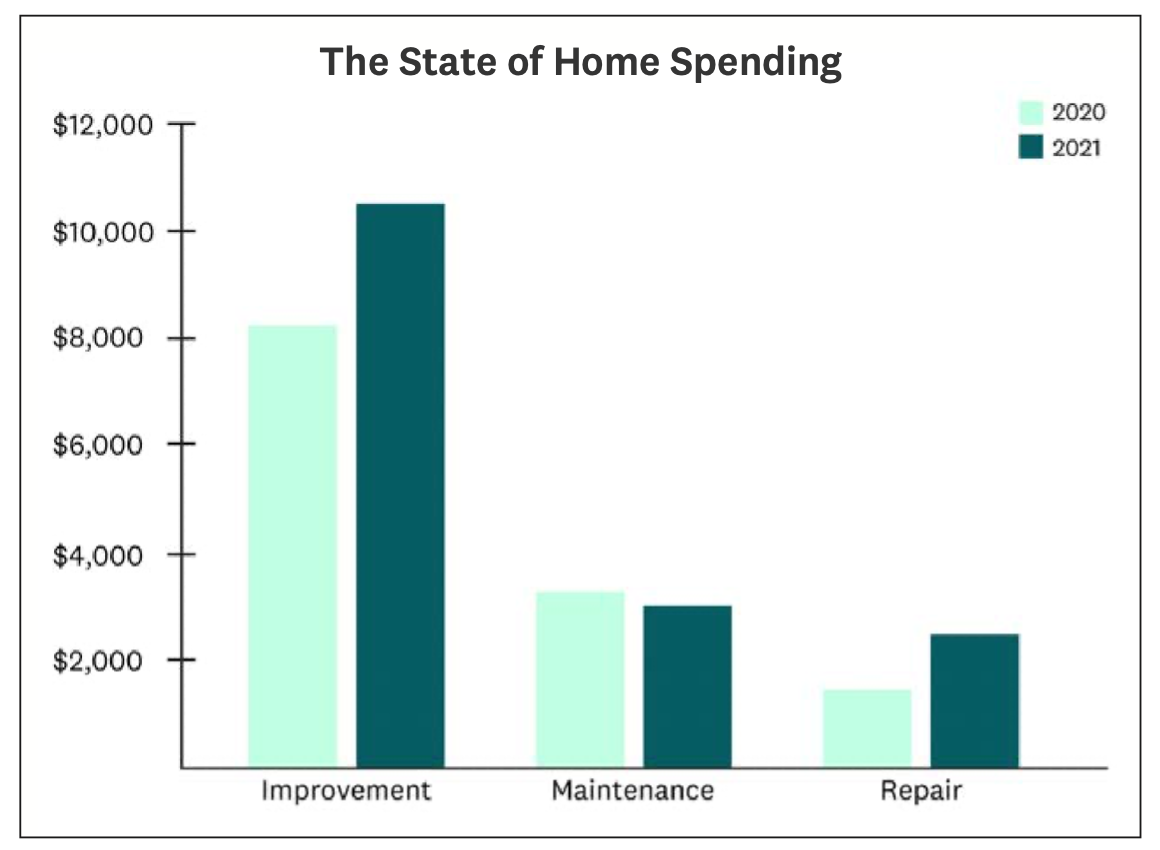
Additionally, demographic tailwinds continue to be a major force in home improvement spending. The largest generational cohort, millennials, continue to be the primary driver of improvement spending, with their role as the top spenders continuing through 2021.
Millennial households spent an average of $11,377; in contrast, their younger cohorts, GenZ, spent a more modest $5,560. GenX, on the later end of peak childrearing years, were the second highest spenders with $10,679 on average, while baby boomer spending subsided this year down from $7,665 to $6,469 on average.
These breakdowns make sense. Millennials are not able to compete with equity-rich baby boomers, who are better able to afford higher-quality homes. So, as millennials step into homeownership in record numbers, they are often buying older homes, or homes that need more remodeling work. Many millennials also fell into what we think of as “core home personalization time” this year. Homeowners tend to take on more projects to customize their homes right after moving in, regardless of how “move-in ready” the home may be. Given the substantial number of millennials who moved this year, we also see this as a key reason for higher spending with this age cohort.
Furthermore, the sheer size of millennials as a generational cohort means that there are simply more people who need housing, increasing the number of people in all economic classes including the lower end of the income spectrum who are pushed down-market into lower-quality or less move-in-ready homes.
This dynamic, combined with distinct preferences and home needs among millennials, explains much of the difference in home improvement spending across the generations.
While home improvement and remodeling grew across the board, home maintenance and emergency repairs are no less important in the long run for preserving our homes’ value. So, with all the spending on home improvement, what happened to home maintenance and upkeep spending in 2021?
1.2 Home Maintenance Spending
Home maintenance spending remained largely the same as last year, but with a slight 4% reduction relative to 2020. Last year, however, maintenance spending jumped up 188% as people started to spend more time at home due to the pandemic.
Over the past two years, maintenance spending has more than doubled. This increased investment in maintenance, and our understanding of how people spend across common maintenance categories, is key to understanding how the pandemic impacts our homes.
This two-year trend is particularly noteworthy given the 20% increase in the value of the average home. There is common wisdom that one should budget approximately 1% of your home’s value every year. With the average cost of a home now at $400,000, consumer behavior is adjusting accordingly.
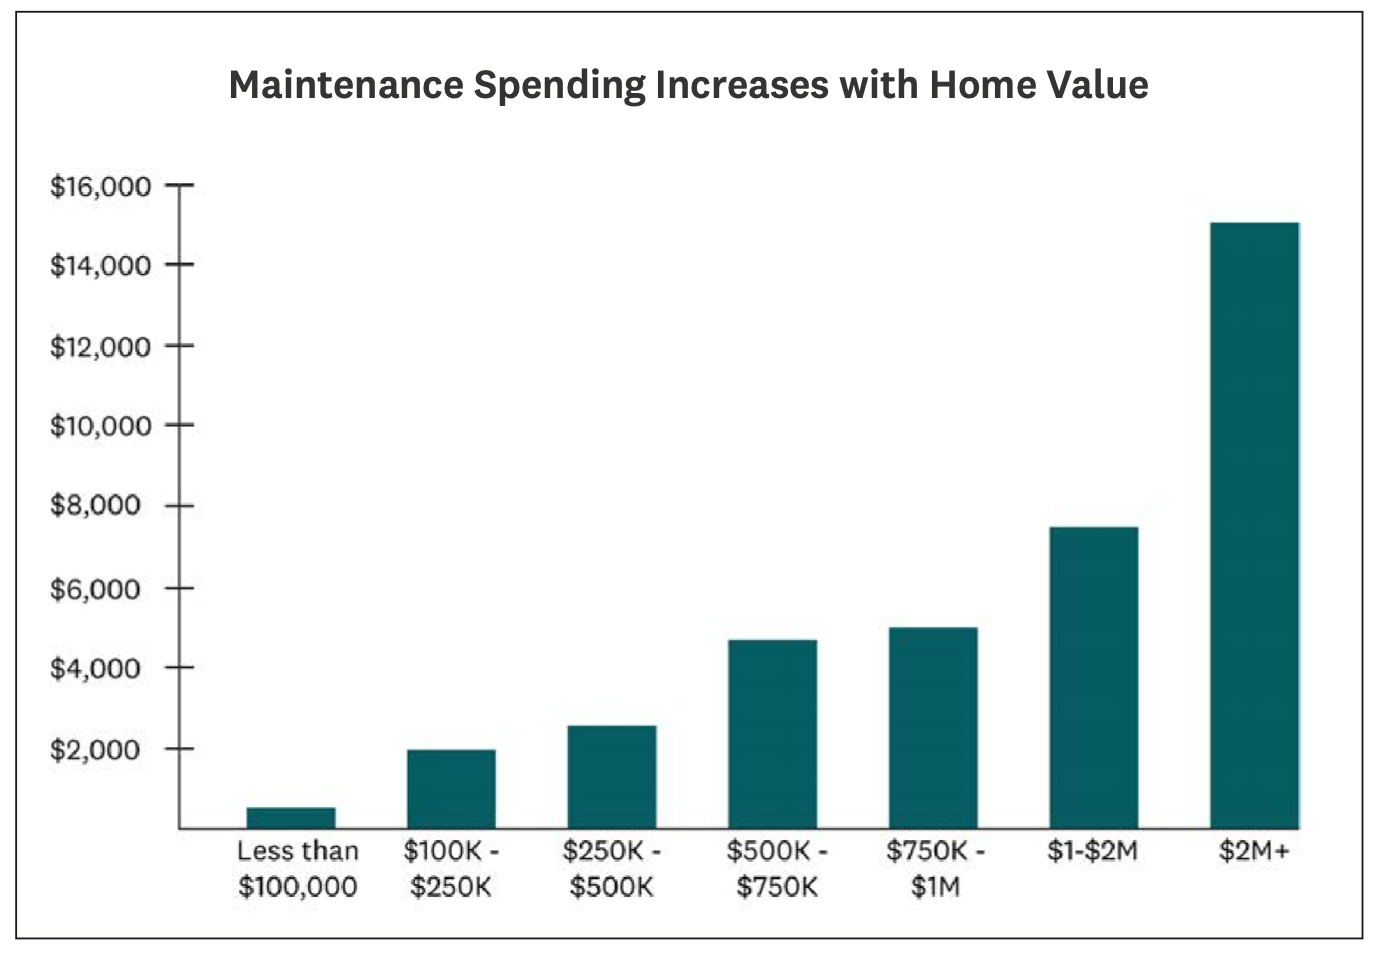
In fact, we have direct evidence that homeowners do in fact increase maintenance spending directly proportionally with home values.
Spending rises directly from an average of $600 per year for the least expensive homes to $15,297 on the most expensive homes, maintaining a constant 0.5% and 1% of home value, regardless of the home’s price.
In addition to understanding how people spend on general maintenance for their homes, we also examined how people spend on the specific maintenance categories of landscaping and cleaning services.
While landscaping and cleaning are both forms of regular maintenance, they are distinctly different from many other tasks as they lend themselves well to high-frequency recurring subscription services to both simplify the task and free up valuable time.
Households in 2021 are much more likely to have people entering their homes than they were in 2020, so it follows that home cleaning increased 19% year over year to an average of 2.5 times. However, since outdoor jobs do not carry the same risks as interior projects, landscaping remained roughly the same as last year, hired out 3.3 times on average.
1.3 Home Emergency Spending
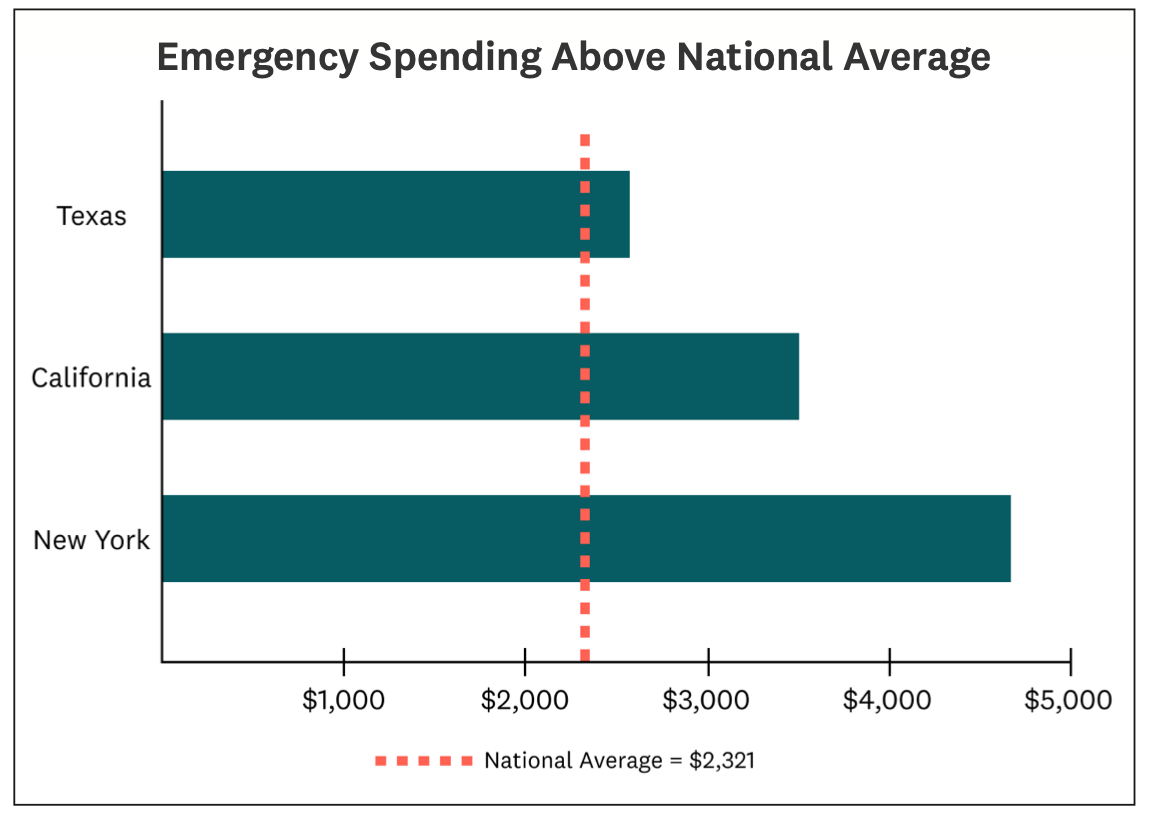
Emergency spending saw the largest growth of the categories we track, rising 42% year-over-year to $2,321.
There are a few key reasons why people are spending more on emergency home repairs this year including extreme weather and increased wear and tear as people continue to spend more time at home.
The increase in emergency spending this year is likely driven by the impact of the extreme weather experienced by many areas of the U.S. in 2021. Extreme weather events often cause expensive home emergencies, and this year had multiple high-profile destructive weather events, such as the cold front that hit Texas early in the year, the wildfires that went through large swaths of California and the hurricane-induced flooding that hit New York. Each of these three states had spending far above the national average (12% higher, 50% higher, and 101% higher, respectively).
Not only did we see an increase in overall emergency spending and spending on unexpected catastrophes, but also saw an increase in the smaller, unexpected issues.
This year, Americans spent, on average, 25% more time at home this year compared to 2019. Higher use of household systems put our homes under more stress, increasing the median amount spent per emergency from $100 in 2019 to $300 in 2021.
Given weather risks and the additional stress on our homes, it would be prudent for consumers to increase their preventative maintenance budgets. There is never a good time for a home emergency, but that is doubly true when labor is scarce, supply chains are snarled, and we still have the lingering challenges of a global pandemic.
1.4 Most Popular Projects
The most popular project of 2021 was interior painting, with 32% of households completing some form of painting project. Bathroom remodels were the second most popular project, completed by 28% of households, and installing a smart home device was the third most common, completed by 27% of households.
The top 10 projects of 2021 were:
| 2021 Rank | Project (Percent of Households Completing) | Change from 2020 | 2020 Rank |
| 1 | Interior Painting (32.2%) | -7% | 1 |
| 2 | Bathroom Remodel (27.7%) | -9% | 2 |
| 3 | Installing smart home device (27.1%) | +41% | 7 |
| 4 | Flooring (26.7%) | +3% | 3 |
| 5 | Landscaping (24.7%) | +3% | 4 |
| 6 | Exterior Painting (24.2%) | +26% | 6 |
| 7 | Kitchen (23.7%) | +5% | 5 |
| 8 | Fencing (23.1%) | +43% | 9 |
| 9 | New Roof (19.6%) | +20% | 8 |
| 10 | New Cabinets (19.5%) | +61% | 11 |
These top projects all provide a dramatic change in either the look (painting, flooring, landscaping) or use (bathroom, smart home device) of one’s home, often without being prohibitively expensive. This balance between cost and value allows consumers to stretch their funds further and to enable their homes to serve more purposes, which is likely in part what led to the extra spending taking place in 2021.
PART 2: HOW A LONG-TERM GLOBAL PANDEMIC IMPACTS HOME SPENDING
With spending booming in home improvement during the prolonged COVID-19 pandemic, and a significant behavior shift regarding time spent at home, what is the mindset of the typical homeowner taking on these projects? Spending on the home increased to the highest levels we have seen in recent years, but what’s driving it? What can we expect to shape spending behavior in the next 1-3 years? What can current behavior tell us about future trends?
Unsurprisingly, the boom in home construction and home sales was fueled by a rush of buying and moving.
This year there have been two significant shifts: the amount of time people spent at home since 2019 and an increase in home buying and moving. Let’s start by exploring the behavior shift in time spent in the home.
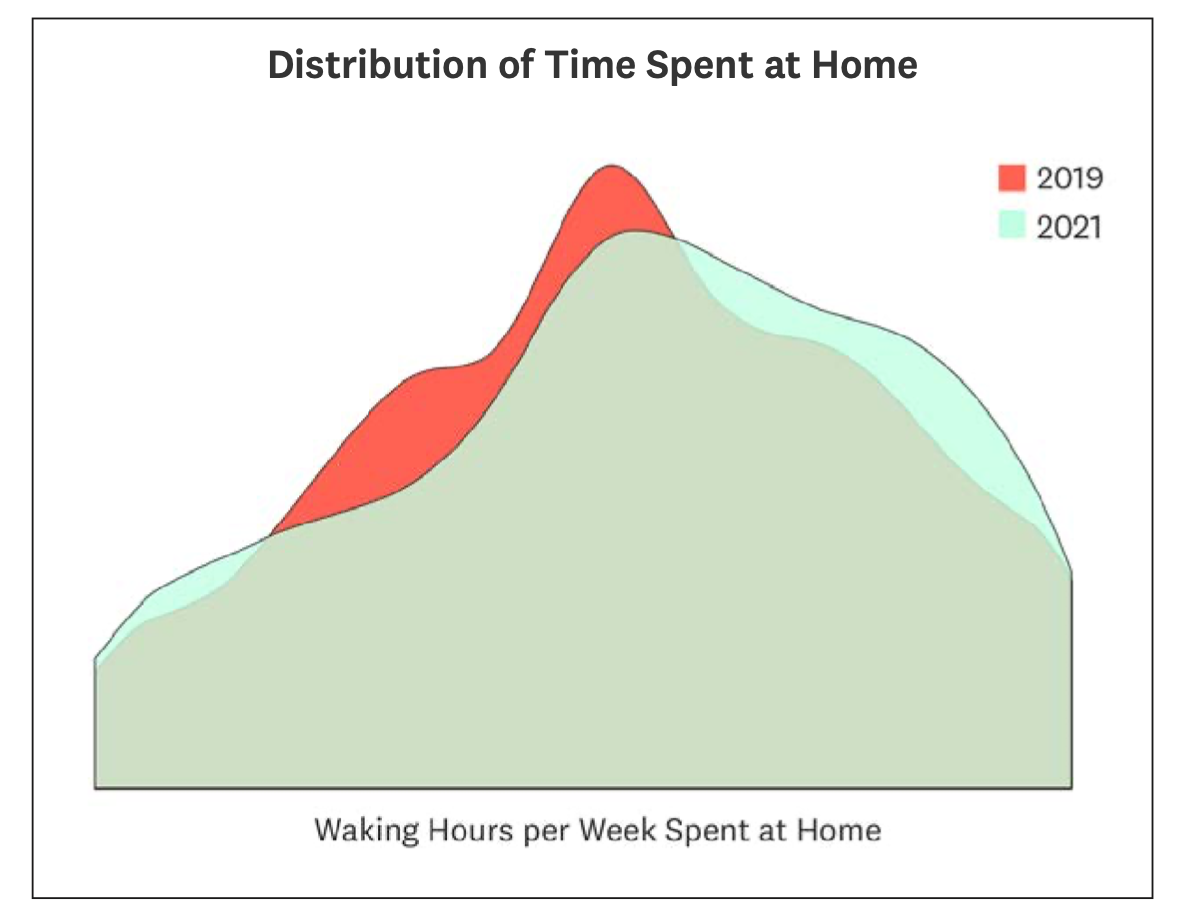
25% of the population is now spending 50% or more time at home than they were in 2019, the last full year before the global pandemic changed how so many people live and work.
Moreover, 14% of the population has doubled the amount of time they spend at home.
There are pronounced economic implications when over one-third of the population has such a drastic shift in how much time they spend at home, including more homebuying, an increased focus on long-term living, changes in home equity, and new obstacles impacting home project completion.
2.1 The Homebuying Rush
As people began, suddenly and all at once, spending more time at home, they also began re-evaluating their homes.
They recognized new needs and decided to buy homes, at record numbers, that better fit those needs. With the many changes driven by the pandemic came a rush of buying, driving up household formation and sales of both new and existing homes.
22% of households surveyed have moved within the last year, illustrating the strong relationship between spending and moving into a new home.
These movers were also particularly likely to be younger, with the under-40 generation 52% more likely to have moved than those aged 40 and above. This explains in large part why millennials and Gen Xers lead the generational pack in terms of high-dollar home spending.
As people started moving more, we wanted to know if their concept of home changed. Are they more inclined to find their “forever home” or less?
In general, homeowners surveyed were evenly split between whether they consider their current home their forever home: 49% do and 51% do not. However, among those that moved during the pandemic, 60% consider their new homes their forever homes while only 40% do not. Pandemic movers are roughly 20% more likely to be in what they now consider their forever homes relative to other households, meaning this cohort of homeowners has a strong incentive to make their homes perfect.
But are their homes perfect now? Hardly. Despite widespread moving, the housing market has been historically competitive as the large, young millennial generation searches for their ideal home.
Historically low interest rates have fueled bidding wars that have priced many out of their preferred homes, resulting in homes that fall short of perfect.
2.2 What’s Wrong with Forever Homes?
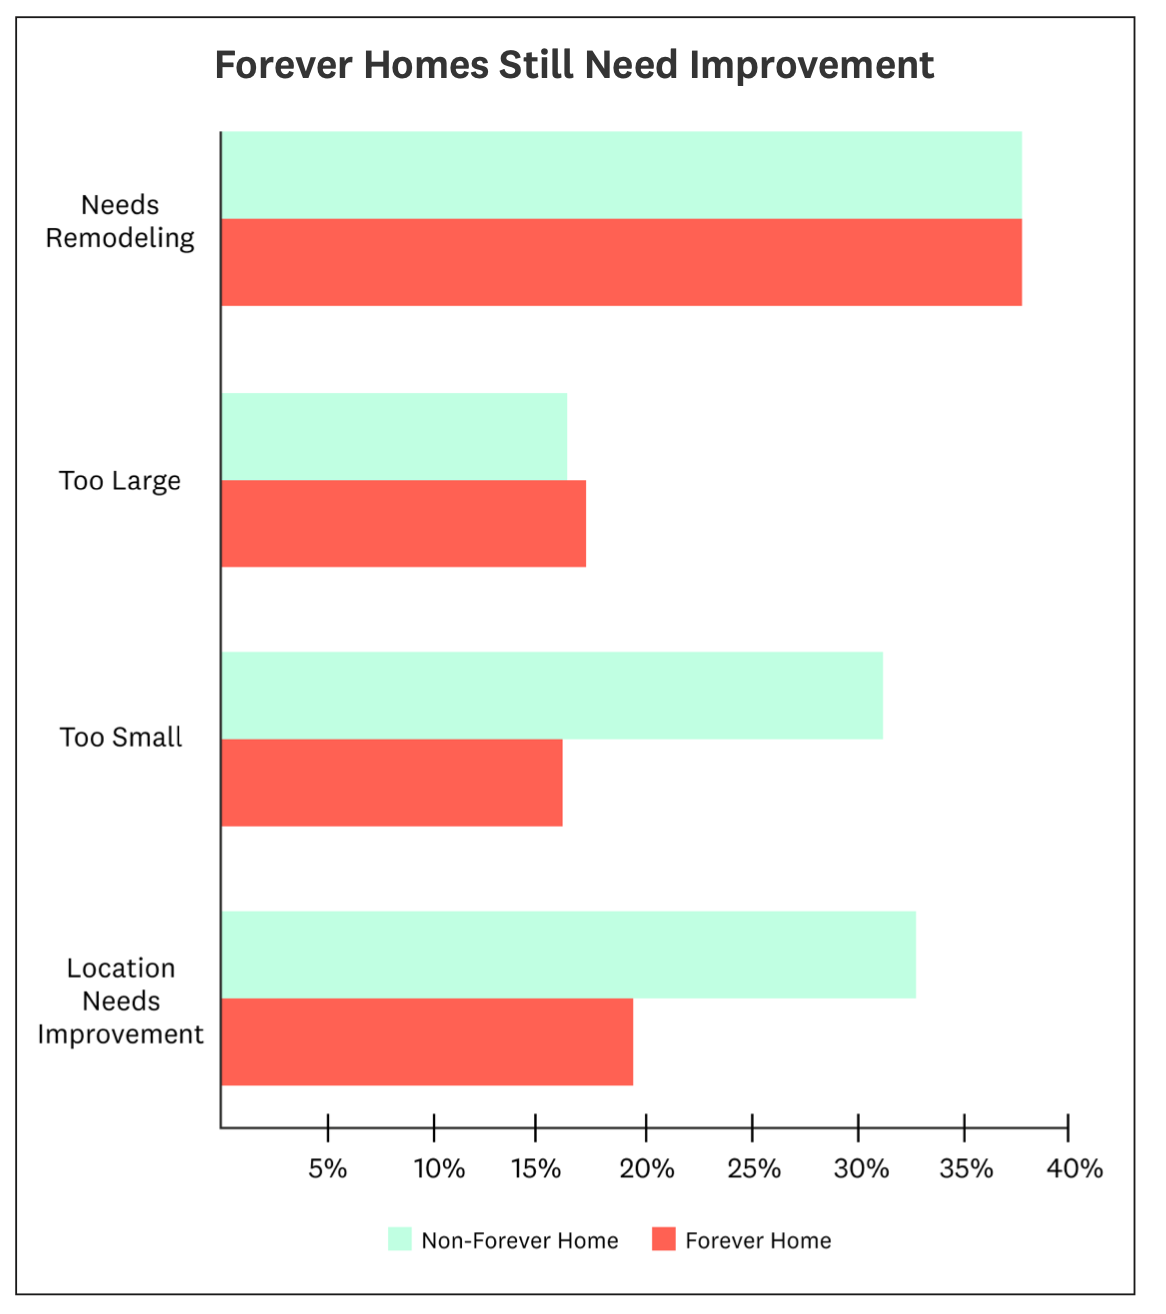
The main characteristics of a “forever home” are location and space. For example, 80% of forever homes are in the ideal location, while only 68% of people in their non-forever homes say their home is in the ideal spot, making forever homes around 20% more likely to be in the ideal location. Similarly, only 16% of forever homes are too small, compared to 31% of other homes, meaning a forever home is about half as likely to be considered too small by the owner.
However, a “forever home” is not necessarily perfect and the desire to improve was strong across all homeowners surveyed. Both forever and non-forever homes fall equally short in terms of needing general remodeling, with 38% of people in their forever homes and 38% of people in non-forever homes saying their homes need remodeling to match their current needs.
This suggests that all the moving during the pandemic has been driven by location and size, not by current amenities or a to-do list of remodeling projects. Both categories of homes needing work means there is pent-up demand for improvement among the millions of households that moved this year that we can expected to see resolved through home projects in 2022 and beyond.
We saw earlier that painting, bathroom remodels and installing smart home devices were the most undertaken projects among all homeowners, all of which balance some amount of value, ease and affordability.
When asked what project they would do if they were given $10,000 for home improvement, homeowners most desired a living room upgrade, selected first by 17% of homeowners and unseating last year’s most desired project of a kitchen remodel. Some of this was driven by a strong living room preference among men, who listed their top three desired projects as living room upgrades (18%), outdoor space upgrades (17%), and bedroom upgrades (15%).
In contrast, the most desired project for women was a kitchen remodel (21%), bathroom upgrade (17%), and outdoor space upgrade (16%), suggesting that an outdoor kitchen with nice living features might be the best way to reconcile the two competing sets of preferences within many households.
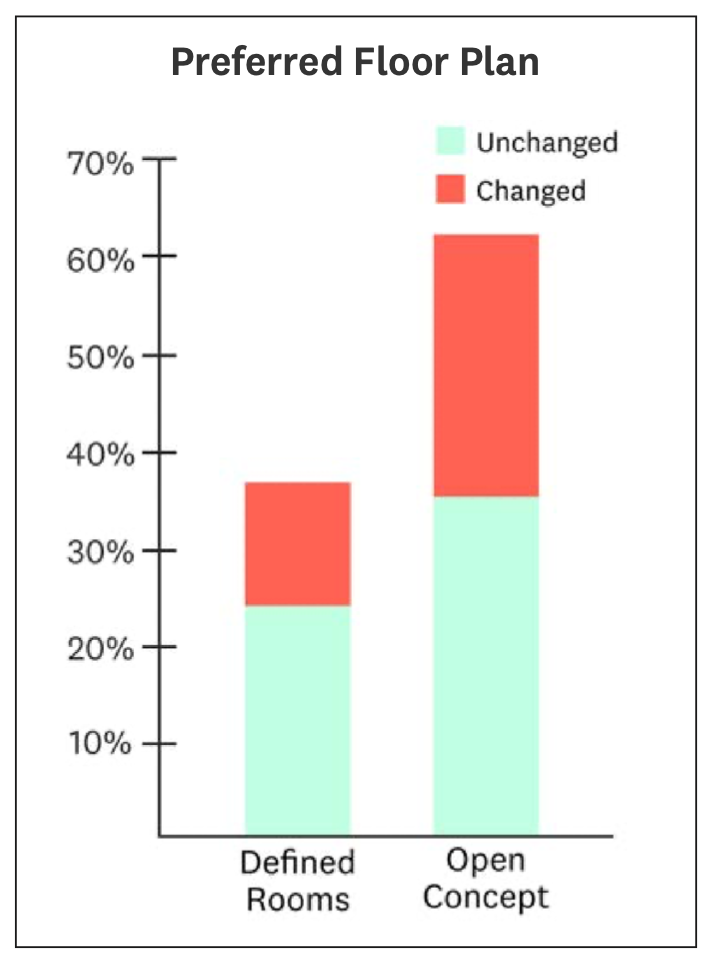
One trend that has not reversed because of the pandemic is the push for open floor plans: the open concept has been declared dead prematurely, as it appears homeowners still like the idea. We find that 62% of households still prefer open concept, and that the pandemic was twice as likely to have moved someone in the direction of preferring open concept (28%) as to preferring defined rooms (13%).
With desired projects, preferences and lifestyle trends established, do consumers have the wealth reserves to actually meet these needs?
2.3 The Trillion Dollar Surprise
Half of all homeowners (49%) gained more home equity than they were already expecting this year; this is on top of the home equity gained but already expected. This was even more true for both recent movers and owners of their forever homes, 54% of whom gained more home equity than they expected.
With home prices up nationally 20%, the proportion of homeowners who gained considerable home equity is even higher.
This means that households are collectively flush with trillions of dollars of new wealth available to support their home projects. Furthermore, households have opened up cash flow from other areas, as not all spending is tied to home equity wealth. Just like last year, homeowners have continued to adjust their budgets, reallocating funds away from things like restaurants, travel and commuting, and into their homes.
However, the proportion of households reallocating funds from eating out and vacation travel both dropped. Households spending restaurant budget on their homes dipped from 52% to 48% this year. Vacation budgets rerouted to spending on the home dropped more – from 48% last year to 38% this year – likely due to the proportionally larger return of vacations and air travel relative to 2020.
In contrast, the share of households shifting commuting budgets into their homes actually increased from 33% last year to 40% this year.
This dramatic uptick aligns with the more permanent-than-expected shift to hybrid or flexible work-from-home arrangements across multiple industries.
COVID-19 created a marked shift in how people intend to spend, causing a 50% higher likelihood of resulting in more improvement spending than less. Consumers have more wealth and more cash flow than they expected.
This means both the demand and the means are there for even more projects in the years to come.
2.4 Are Projects Getting Easier or Harder to Complete?
As homeowners have taken on more home projects, they have faced complications along the way. However, there is also evidence that skilled trades professionals have been improving their planning and communication with customers during the pandemic.
Delayed arrival of products or materials was the top reason for projects to go over time or over budget, ranked first by 22% of homeowners. Contractors taking longer than expected was the second leading cause of project delay, listed first by 21% of homeowners, and hidden surprises were the third most common culprit, listed first by 17% of households.
Hidden surprises are a part of all improvement and remodeling. The broad diversity of housing types, ages, styles, climates and owner histories ensures that no two remodeling projects are ever the same. However, the top two reasons for delays – contractors and materials taking longer than expected – are both likely to be temporary, as product material shortages and labor shortages among the skilled trades are both currently driving up project complexity and opportunity for delay.
Additionally, there is some evidence that contractors are getting better at time estimation. Last year, at the height of the pandemic, projects were three to four times more likely to go over time or over budget rather than come in ahead of schedule or under budget. That improved considerably this year, to the point where projects were equally as likely to go under budget as over, and only about 30% more likely to go over schedule than finish early. This marked improvement could be a function of reduced COVID-19 uncertainty, skilled trades pros building in more time as they communicate with consumers, and the 42% of pros who adopted new digital planning technologies.
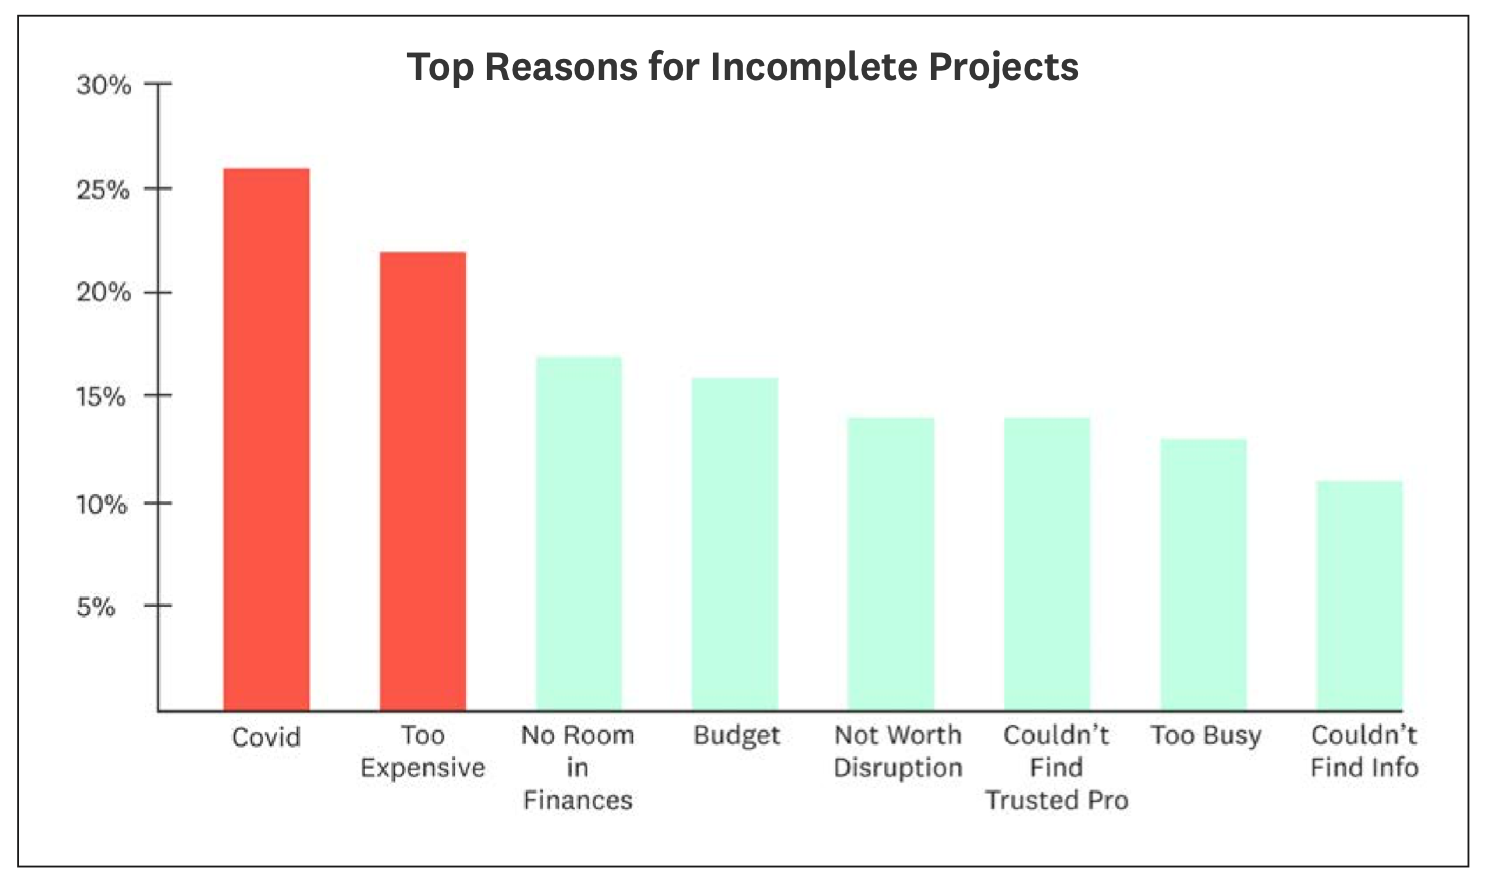
For projects that were not completed, COVID-19 was still listed as the primary reason, accounting for over a quarter (26%) of all uncompleted projects. The second most common reason was projects being too expensive, accounting for 22% of all incomplete projects. Together, this means that as material prices return to Earth, supply chains stabilize and the pandemic wanes, nearly half of this year’s barriers to project completion will potentially disappear, resulting in even more growth in demand for home projects.
Summary
In 2021, the boom in home spending spurred by the global pandemic continued and is quickly becoming a potentially enduring trend. In 2020, spending in the home was hurried and rush, spurred by both need and fear. This year, spending continued, but instead of being driven by fear, it was driven by a clear understanding of the importance of the home and of what homeowners need to make their homes work for them and their families in our “new normal.”
Home improvement spending rose an additional 25%, with consumers increasing both their total spending and the number of projects they undertook.
While maintenance spending largely remained the same, emergency spending increased by 42%, suggesting that 18 months of added stress on our home systems, as well as shocks from extreme weather, are both resulting in more unexpected problems.
The need for our homes to better suit our evolving lives continues to dominate the primary reason for improvement spending. And in 2021, more people moved into their “forever homes.” But interestingly, we saw for most homeowners, “forever home” did not mean the perfect home. Actually, 68% those forever homes are falling short of being perfect.
2021 will likely go down as one of the most memorable of all time in the modern housing and home improvement market, and the boom from both existing demographic tailwinds and the unexpected shift to home-centered lives will likely continue for years to come.
Finally, this year, over half of homeowners that unlocked unexpected home equity (54%), have more wealth than anticipated to put towards improving, maintaining and repairing their homes.
2021 will likely go down as one of the most memorable of all time in the modern housing and home improvement market, and the boom from both existing demographic tailwinds and the unexpected shift to home-centered lives will likely continue for several years to come.
Methodology
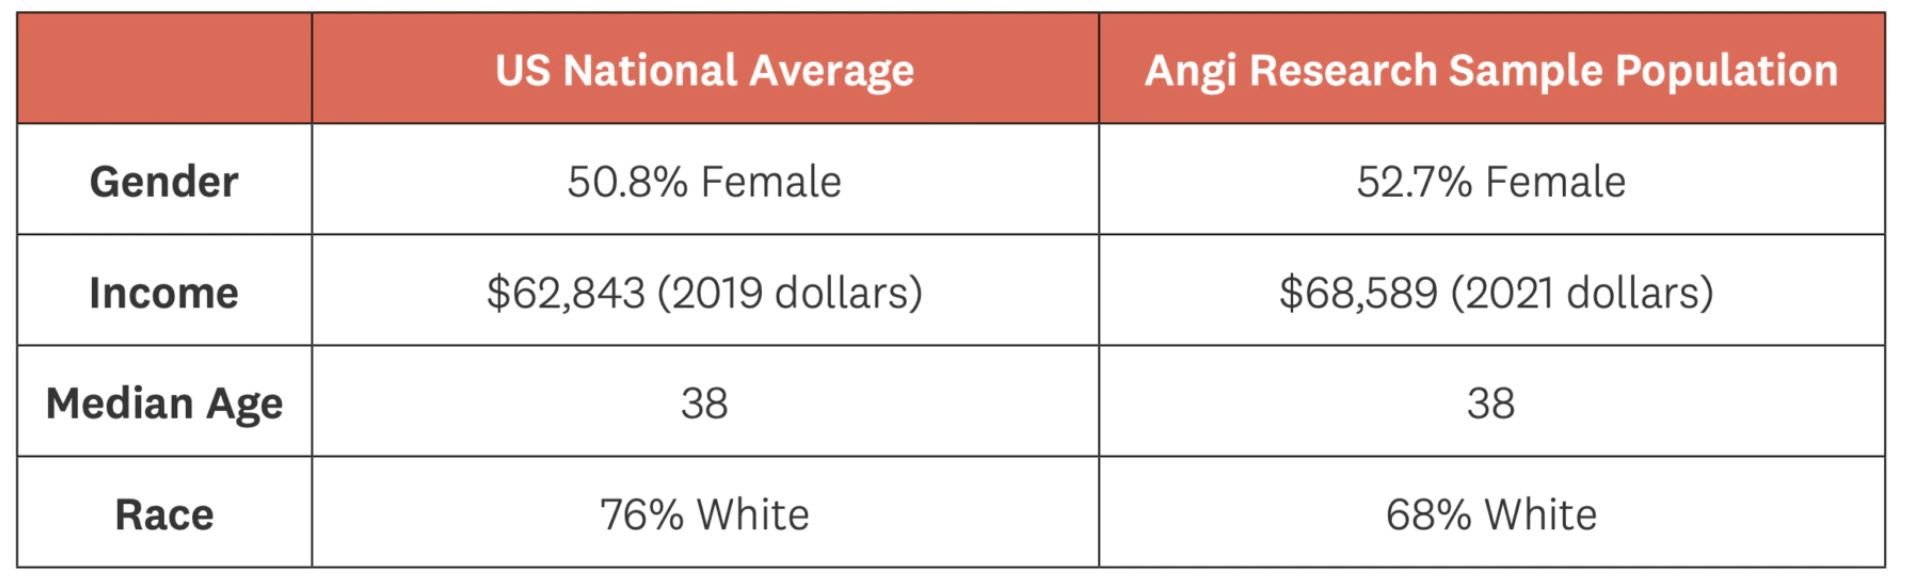
The State of Home Spending is based on Angi analysis of surveys fielded to 6,400 consumers between October 4th and October 7th, 2021. The full sample consists of a survey of the general population (n=5,000) and a survey of homeowner households that completed a remodeling project in the last 12 months and hired someone else do to at least some of the work for them (n=1,400). The general population survey was post-sample weighted to balance the sample against general population statistics for age, gender and income to determine average spending and project volume. All statistics, unless otherwise noted, refer to homeowner households that completed an improvement project.
Our baseline sample population closely approximates the full US population, and is benchmarked below for full transparency:
US Population Estimates: https://www.census.gov/quickfacts/fact/table/US/PST045219
Contacts
For information about this report or other research or analysis questions, you can contact the Angi Research team:
angi.com/research
Mallory Micetich
Vice President, Corporate Communications
Angi
mediarelations@angi.com
Mischa Fisher
Chief Economist
Angi
insights@angi.com
 Press & Media Inquiries
 Angi Economics