
Now Is the Worst Time to Buy a Home in the Last 15 Years
Key Takeaways
- 30-year mortgage rates rose to 5.11% for the first time in over a decade
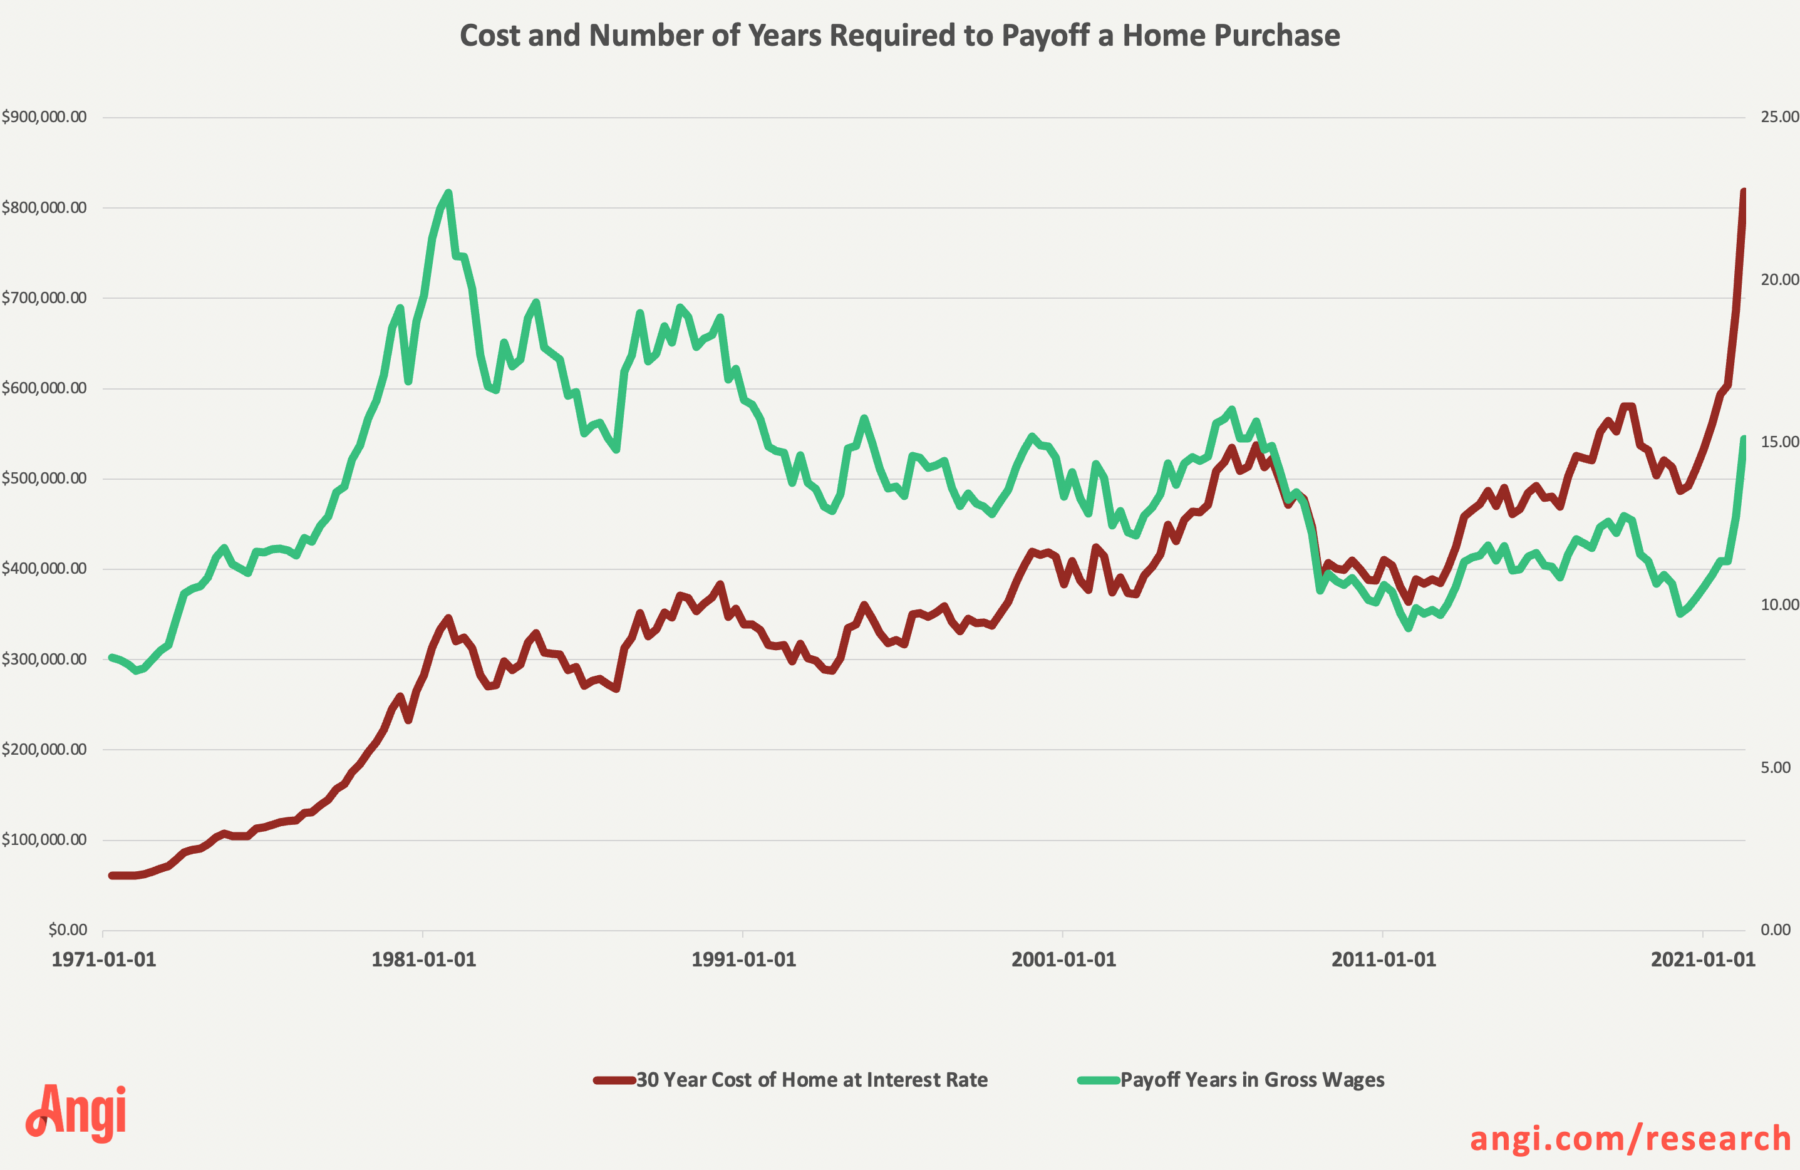
- The combined cost of a home – base price and mortgage rate – has produced the highest lifetime cost on record, approximately $818,000, while year-over-year rent inflation is at the highest it’s been since 2007.
- In the debate over loving it or listing it, loving it and remodeling just gained a competitive edge. The number of years it would take a typical worker to pay off a newly bought home using their gross hourly wage rose by nearly 50% in the last 12 months.
- As interest rates rise past 5%, we should expect demand for houses to normalize and for remodeling to become more competitive as buying a house becomes a comparatively worse deal than remodeling one.
The Rapid Cost Increase in Buying a Home
By now most people in the U.S. have seen or have heard of the popular home show, “Love It or List It.” This show asks a question that many Americans will answer throughout their homeownership journey, when their current home stops meeting their needs and it is time for a change or updates. Is it time to love it or list it? Now with how our economy is changing, this question is highly complex.
The considerations and the math surrounding whether or not you should remodel your home (love it) or buy a new one (list it) has changed dramatically over the past three months.
The average rate for a 30-year mortgage increased from a little over 3% in the final quarter of 2021 to 5.11% this week. This means that the total amount of interest paid over 30 years for a $300,000 house rose from approximately $140,000 to over $250,000. What’s more, the supply of houses at $300,000 has shrunk considerably given the 20% year-over-year increase in home prices. These two trends together makes it the most expensive time to ever buy a house.
“the total amount of interest paid over 30 years for a $300,000 house rose from approximately $140,000 to over $250,000”
Controlling for wage growth – which gives us a sense of affordability of a house on a typical worker’s wages – the picture is less stark. The number of years one has to work to pay for a new home purchase (using their gross income) has increased nearly 50% in the last 12 months to 15.11 years from 10.9 years – the highest level since the great recession. This chart above explains this current phenomenon, where the red line and left vertical axis shows the rapid run-up in the total cost of buying a home over the life of a 30-year loan, and the green line with the right axis shows the number of years a worker would need to work to pay off that cost using their total gross hourly wages.
“the number of years one has to work to pay for a new home purchase (using their gross income) has increased nearly 50% in the last 12 months”
Affordability Silver Lining
Despite this rapid increase and that buying a home is now more expensive than anytime in the last 10 years, housing remains relatively affordable compared to the highs of the 1980s, when homebuyers faced pay-off times of over 20 years.
Another silver lining: refinancing remains an option for anybody currently buying a house on a higher mortgage rate, in the event mortgage rates drop at any point in the future. This ratcheting down effect continues to make home buying a better hedge against inflation than renting in the medium and long-term.
“This ratcheting down effect continues to make home buying a better hedge against inflation than renting in the medium and long-term.”
tl;dr
In the debate over loving it or listing it, loving it and remodeling just gained a competitive edge.
The increase in mortgage rates – combined with rapid house price appreciation – means buying a home has become a comparatively worse deal than improving your existing one. But this will likely only lead to a cooling of the housing market, not a reversal, because housing affordability based on worker wages remains within its historical average of 12-15 yrs of gross income.
Methodology
Sources: Author’s analysis of Average Hourly Earnings of Production and NonSupervisory Employees, Total Private, Dollars per hour, US BLS CES via Federal Reserve Bank of St. Louis; Median Sales Price of Houses Sold for the United States, US HUD NRS, via Federal Reserve Bank of St. Louis; 30-Year Fixed Rate Mortgage Average, Freddie Mac via Federal Reserve Bank of St. Louis.
Affordability can be measured multiple ways, benchmarking against gross average hourly earnings is one method. Also total costs here do not include PMI, differential down-payment amounts, point-based mortgage rates, property and income taxes, deductions, homeowners insurance, or buying and selling costs.


 Press & Media Inquiries
 Angi Economics